Clinical Cytogenetics and Molecular Cytogenetics
History and Background
Cytogenetics is the study of chromosomes, the packages of DNA and protein that enable cells to distribute their genetic material properly when they undergo division. The field of clinical cytogenetics has accompanied most baby boomers throughout life, and we tend to lose sight of the fact that it is no older than we are. In July, 2006 a large group of cytogeneticists gathered at the National Institutes of Health to celebrate, acknowledge and reflect on “50 Years of 46 Human Chromosomes,” marking the anniversary of the discovery of this number in 1956 (prior to this, humans “had” 48 chromosomes!) that laid the groundwork for this new field of medicine.
This discovery, like many before and since, was the result of a laboratory accident. In 1952, T.C. Hsu reported that visualization of human chromosomes could be improved by growing cells using the then- recently described tissue culture techniques rather than relying on squash preparations (1). At the end of his paper, he acknowledged that the improved mitotic figures he published were the result of accidentally soaking the cells in a hypotonic solution instead of isotonic saline. It was the resultant swelling of the cells that facilitated chromosome separation and identification. Yet, even after this accident, Hsu insisted that he was able to visualize and diagram all 48 human chromosomes!
Four years later, utilizing this “hypotonic shock” and a new colchicine treatment for destroying spindle apparatus and accumulating mitotic cells, Tjio and Levan reported that “…we do not wish to generalize our present findings into a statement that the chromosome number of man is 2n=46, but it is hard to avoid the conclusion that this would be the most natural explanation of our observations.” (2)
Within four years several human trisomies and the first chromosome abnormality to be associated with cancer had been described (3 – 9). Several more reports of chromosome abnormalities followed, and in the late ‘60s and early ‘70s methods to produce the light and dark bands that enable us to accurately identify each chromosome pair and visualize structural chromosome abnormalities were developed (10 – 12), leading to the karyotype, the ordered arrangement of chromosome pairs, that we have all become familiar with, and the true birth of clinical cytogenetics.
Cytogenetics and FISH in Clinical Practice
The study of human chromosomes plays a role in the diagnosis, prognosis and monitoring of treatment involving conditions seen not only by medical geneticists and genetic counselors, but also by pediatricians, obstetrician/gynecologists, perinatologists, hematologists, oncologists, endocrinologists, pathologists, urologists, internists and family practice physicians. In addition, cytogenetic testing must often be dealt with by hospital laboratory personnel and managed care organizations.
Few esoteric clinical laboratory disciplines have the potential to affect such a broad range of medical specialties, yet cytogenetics is often less well understood than most “specialized” testing.
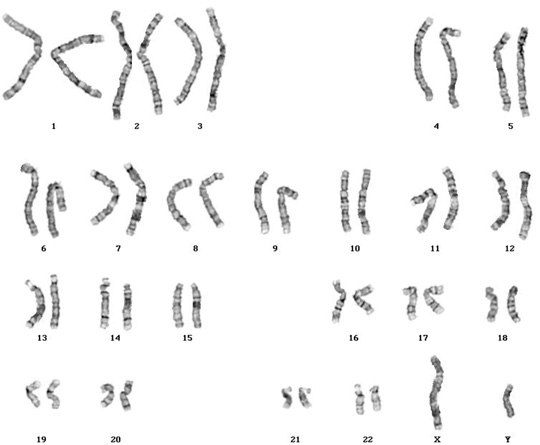
Figure 1: G-Banded normal male karyotype (46,XY)
One can attribute this to several causes:
- The cytogenetics laboratory is essentially the only setting in which living cells are required for traditional testing (fluorescence in situ hybridization [FISH] provides an exception to this rule). This unusual sample requirement is a potential source of confusion and specimen rejection.
- Cytogenetics is still perceived, and rightly so, to be as much “art” as it is science in an era when most clinical testing is becoming more and more automated and/or “high tech.”
- Genetics in general still does not receive sufficient emphasis in the training of medical personnel.
This issue has been complicated in recent years because, in an era of molecular medicine, chromosome analysis has become somewhat less of a stand-alone discipline; as genes are mapped to chromosomes, traditional cytogenetics is often augmented with DNA analysis and/or FISH. The latter, often referred to as “molecular cytogenetics,” has become such an integral part of the typical cytogenetics laboratory, with such a wide variety of applications, that it represents the single most significant advance in this field in decades. Based on long-standing in situ hybridization techniques, this application uses fluorescently labeled DNA probes to identify abnormalities in chromosome number and structure, often identifying changes that cannot be observed or classified through the light microscope. FISH is performed using probes to detect gene rearrangements or amplifications associated with neoplasia, microdeletions that are associated with a variety of syndromes, and ploidy status for prenatal diagnosis or oncology. Chromosomes can also be “painted” with FISH probes, a useful way of classifying marker chromosomes or elucidating complex chromosomal rearrangements.
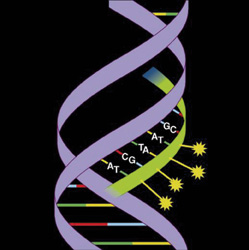
Figure 2: Diagram of a fluorescently labeled probe hybridized to target DNA
Choosing a Laboratory
How does one determine that one cytogenetics laboratory can serve one’s patients in a superior way? What are the criteria of a “great cytogenetics laboratory?” The easy answer is “turn-around time and service.” But what does this really mean?
Consider the field of prenatal cytogenetics. When this application of clinical chromosome analysis was developed in the 1970s, ultrasound equipment was archaic by today’s standards, and most physicians were loathe to perform amniocentesis before 17 weeks of gestation. Cells were grown in T25 culture flasks, a process which took weeks before a sufficient number of dividing cells was available for analysis. Turn-around time from sample collection to report was typically four weeks or more, and therefore the need for follow-up parental chromosome analysis created incredible time pressure and anxiety.
Laboratories began to distinguish themselves by chipping away at this turn-around time. Some touted using one of the new synthetic culture media that had been developed to make cultures grow faster. Others bragged about their triple gas incubators, which infused nitrogen to reduce oxygen tension, also improving growth. Many were vocal about adopting the new in situ culture method, which allowed/required culture harvest at 7 to 10 days instead of weeks. Devices to maximize the processing yield of such cultures were quickly invented.
And of course, while all this was taking place, improvements in radiological instrumentation and physician experience were producing amniotic fluid samples at earlier and earlier gestational ages.
But the days of gaining a TAT advantage by using gadgetry and culture wizardry are over. All laboratories have access to the same tools, none use flasks any more, and the human cell cycle cannot be changed. So why do some laboratories excel here? The answer has to do with experience and work flow. The former is vital, for it is the confidence to know which very early cultures are going to yield an appropriate number of cells for analysis that allows the laboratory to process cases as soon as possible, and such confidence requires experience.
However, harvesting cultures as soon as possible does not guarantee turn-around time. For example, consider that all laboratories process routine unstimulated bone marrow specimens with 24- and 48-hour cultures. Yet TAT for these samples can vary from 2 days to 3 or more weeks from laboratory to laboratory!
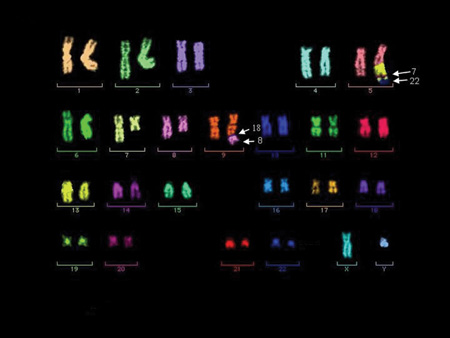
Figure 3: Multiplex FISH (M-FISH) – Each chromosome is “painted” a different color so that abnormalities can be characterized.
The ultimate key to turn-around time is workflow. In our laboratory, one wall of the microscope room consists of large magnetic boards. A color-coded magnet is created for each patient, and a schedule of when cases are to be analyzed is posted. Each day, the appropriate magnets are lined up in the “to be analyzed” column and are then subsequently moved across the board as various steps of the analysis procedure are completed. This allows any of us to determine where any patient is in the process quite easily. However, of greatest importance is that EVERY CASE THAT IS SCHEDULED FOR ANALYSIS IS COMPLETED AND REPORTED THAT DAY. No cases are ever left over. We have no backlog here, an unusual situation for a cytogenetics laboratory, given the labor-intensive nature of the work. Our technologists understand that they are working on patients, not merely specimens, and for this reason the philosophy of never allowing a case backlog to exist begins in the laboratory. Laboratory management does not need to stress this philosophy – our techs technologists wouldn’t have it any other way.
We also take advantage of offering full-service hematopathology by including one simple but unusual step in our culture of all bone marrow samples – we run every one through one of our flow cytometers prior to culture initiation, for analysis of cell count and viability (but not for immunophenotyping). This is particularly valuable given that many of our bone marrow aspirates are 2 days old when we receive them. While a certain percentage of no-grow cultures is unavoidable with bone marrow cytogenetics for a variety of clinical reasons, this one simple protocol has reduced if not eliminated the number of non-medical or unexplained culture failures in our laboratory.
Next, our protocols would not be very valuable if we didn’t also monitor their effectiveness. Again using prenatal cytogenetics as an example, we find it insufficient to merely measure our mean turn-around time. While this is a valuable data point, as is our TAT range, of greater importance for both clinician and trend monitoring is to keep track of the percentage of cases that are completed within a certain number of days (we do this monthly, quarterly and annually). The resulting “S-curve” provides more useable data:
Figure 4: Turn-Around Time For Chromosome Analysis, Amniotic Fluid June, 2006 n = 22 Mean = 7.3 Days
In this example, not only do we demonstrate an average turn-around time of 7.3 days with a range of 5 to 12 days, it can also be seen that 50% of cases were completed by day 6, 63% by day 7, and over 90% by day 10. Examining these curves each month can also alert the laboratory to any negative trends that might be developing, allowing them to be analyzed and corrected before referring physicians see any change in service.
It’s also important to stay current, especially where FISH analysis is concerned. New probes are always arriving on the scene, and one must stay abreast of the literature and adjust testing appropriately. One good example involves the FISH panel for multiple myeloma. In the past this involved probes for two chromosomes (13 and 17) and one translocation (IGH and CCND1, also called BCL-1). Based on new information, our myeloma panel now screens for numerical or structural abnormalities involving six chromosomes (5, 9, 11, 13, 15, 17), plus any rearrangement involving IGH, which, when positive, reflexes to probes for three specific translocations with prognostic implications. We are also in the process of validating an additional probe for our CLL FISH panel, and will continue to stay current with all FISH testing.
Finally, getting results out in a timely manner isn’t valuable unless important clinical information gets to the physician who needs to act on it. For this reason, all critical or abnormal results are telephoned to the referring physician. Warde clients may receive requests for contact information, which should never be construed as any kind of competitive espionage, but merely which is our way of providing your own clients and their patients with the best patient care possible.
These practices allow us to eliminate the need to provide “preliminary reports,” a gimmick that many cytogenetics laboratories employ in an effort to make their TAT seem better than it actually is. This practice is fraught with the potential for disaster, as one can readily imagine. We will, of course, notify a physician once it has been determined that a bone marrow aspirate is extremely abnormal, especially if the case will require additional time or methodologies to sort out.
Why We Ask for So Much Information
No laboratory likes to bombard a physician’s office or hospital with endless requests for patient information, and at times it may seem like we’re asking for data just to ask for it.
I was once asked, “Why do you need to know what’s wrong with this patient? Shouldn’t you be able to diagnose a chromosome abnormality regardless of what we might suspect?” This is an excellent question, and in some scenarios there is some validity to this concept. However, there are many more situations where appropriate clinical information allows us to render a proper diagnosis. For example:
- Bone marrow – for decades, B-cell disorders have proven refractory to cytogenetic analysis, because the target cells do not divide spontaneously as blasts and other immature forms do. Laboratories have been searching for appropriate mitogens or mitogen cocktails, with varying degrees of success. Recently several such cocktails have emerged, and our own data proves that we are now identifying abnormal clones that would have been missed without stimulating these cultures. We do, however, need to know when to add them, as they require additional culture time (the slightly longer turn-around time is a worthwhile price for improved detection of abnormal clones) and are of no value for non-lymphoid disorders. Therefore, proper clinical information results in improved diagnosis.
- Chromosome analysis of a dysmorphic child – while chromosomes can now be “high resolution”, certain syndromes are associated with particular chromosome abnormalities, some of them quite subtle. Knowing where to focus, particularly with chromosomes too long for the average karyotype, can allow the laboratory to detect something that might not otherwise have been seen. Also, since FISH is now the diagnostic method of choice for most microdeletion syndromes, we need to know which probe(s) to use.
- Family history. We recently received blood on an infant with an indication of “mother carries a balanced translocation.” However, the details of this rearrangement were not provided. While we were comfortable that we had a baby with normal chromosomes, it is simply bad medicine not to have specifically determined (and documented) that she did not carry her mother’s translocation. Chasing down this information resulted in a 2-day delay in reporting results.
The take home message here is the more complete the clinical information provided to the cytogenetics laboratory, the more precise our diagnosis will be.
Summary and Laboratory Data
After all the pontificating and analysis, there are several data points that must be monitored by both the laboratory and its end-user clinical facility. Turn-around time is always front and center here, but it is also important to track abnormal rates and failure rates for each tissue type. While these are of course somewhat subject to “client mix,” over time they still facilitate the laboratory’s ability to detect trends.
At the time of this writing, our laboratory has produced the following YTD data:
If there are any questions, I can be reached at 203-447-8601 or sgersen@ameripath.com
Steven L Gersen, Ph.D.
Managing Director
Director, Cytogenetics and FISH Laboratories
References
- Hsu, T.C. and Pomerat, C.M. (1953) Mammalian Chromosomes in vitro. II. A method for spreading the chromosomes of cells in tissue culture. J. Heredity 44, 23-29.
- Tjio, H.J. and Levan, A. (1956) The chromosome numbers of man. Hereditas 42, 1-6.
- Lejeune, J. Gautier, M. and Turpin, R. (1959) Étude des chromosomes somatiques de neuf enfants mongoliens. Compt. Rend. Acad. Sci. 248, 1721-1722.
- Ford, C.E., Miller, O.J., Polani, P.E., Almeida, J.C. de and Briggs, J.H. (1959) A sex-chromosome anomaly in a case of gonadal dysgenesis (Turner’s syndrome). Lancet I, 711-713.
- Jacobs, P.A. and Strong, J.A. (1959) A case of human intersexuality having a possible XXY sex-determining mechanism. Nature 183, 302-303.
- Jacobs, P.A. Baikie, A.G., MacGregor, T.N. and Harnden, D.G. (1959) Evidence for the existence of the human “superfemale.” Lancet II, 423-425.
- Patau, K., Smith, D.W., Therman, E., and Inhorn, S.L. (1960) Multiple congenital anomaly caused by an extra chromosome. Lancet I, 790-793.
- Edwards, J.H., Harnden, D.G., Cameron, A.H., Cross, V.M. and Wolff, O.H. (1960) A new trisomic syndrome. Lancet I, 711-713.
- Nowell, P.C. and Hungerford, D.A. (1960) A minute chromosome in human chronic granulocytic leukemia. Science 132, 1497.
- Caspersson, T., Zech, L. and Johansson, C. (1970) Differential binding of alkylating fluorochromes in human chromosomes. Exp. Cell Res. 60, 315-319.
- Caspersson, T., Lomakka, G. and Zech, L. (1971) The 24 fluorescence patterns of the human metaphase chromosomes – distinguishing characters and variability. Hereditas 67, 89-102.
- Drets, M.E. and Shaw, M.W. (1971) Specific banding patterns in human chromosomes. Proc, Nat. Acad. Sci. USA 68, 2073-2077.